MTR, ping, and all 19 tools are free. No ads, no account required.
What PingKit's MTR Tool Does
MTR (My Traceroute) merges the functionality of ping and traceroute into a single diagnostic tool. Instead of showing you the route once, PingKit's MTR continuously probes every hop between your iPhone and the destination, building up statistical data that reveals intermittent problems a one-shot traceroute would miss entirely.
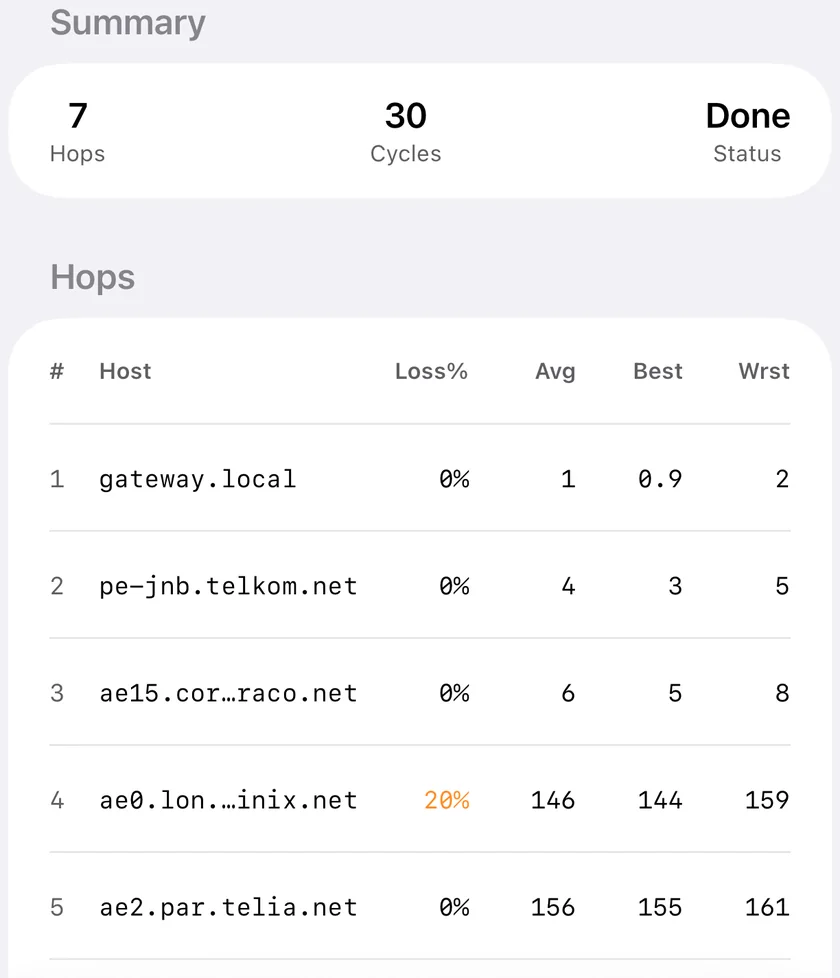
Hop four is losing twenty per cent while everything past it loses none, which is a router deprioritising ICMP and not a fault.
Continuous Monitoring
MTR doesn't stop after one pass. It keeps probing every hop, accumulating data over time so intermittent packet loss and latency spikes become visible in the statistics.
Per-Hop Statistics
See the loss percentage and the best, average and worst latency for each individual hop along the route. Identify which router or network segment is introducing delay.
Packet Loss Detection
Track loss percentage at every hop independently. Distinguish between real packet loss and ICMP rate-limiting by comparing loss patterns across consecutive hops.
Real-Time Updates
Watch statistics update live as each probe returns. No waiting for a test to finish before you can see results. Spot problems the moment they appear.
When to Use MTR
Finding the Problem Hop
Your connection is slow but you don't know why. A speed test tells you something is wrong; MTR tells you where. Run it to the destination and look for the first hop where latency jumps or loss appears. That's the bottleneck, and now you know whether it's your local network, your ISP, or somewhere further upstream.
ISP Diagnostics
When you suspect your ISP is the problem, MTR gives you the evidence. Run tests to multiple destinations and look for patterns. If loss consistently appears at the same hop within your ISP's network regardless of destination, you have a clear case to present to their support team with specific router addresses and loss percentages.
Network Path Analysis
Understanding how your traffic reaches a destination can explain unexpected latency. MTR reveals the complete path including geographic detours, peering points, and CDN routing decisions. If your traffic to a nearby server takes a round trip through another continent, you'll see it in the hop-by-hop data.
Proving Routing Issues to Your ISP
Calling your ISP and saying "my internet is slow" rarely gets results. Calling with MTR data showing 15% packet loss at their specific router IP address does. PingKit's MTR results include everything a network engineer needs: hop addresses, loss percentages, and best, average and worst latency accumulated over many passes.
How the Test Actually Runs
MTR runs in two phases. First PingKit maps the route once, sending a single ICMP echo request with a TTL of 1[source], then 2, and so on, up to thirty. Each probe waits up to two seconds for a reply. Discovery stops as soon as the destination itself answers, or after five silent hops in a row, so a path that ends behind a firewall does not cost you thirty timeouts before the table appears.
Then it settles into the loop that makes MTR different from traceroute. Once a second, PingKit re-probes every hop it found, in order, and folds each result into that hop's running figures. It keeps going until you tap Stop. A pass therefore always takes a little over a second, and longer when a hop is silent, because each silent hop spends its full two-second timeout before the pass moves on.
All of this happens on the iPhone. PingKit uses the unprivileged ICMP socket iOS grants any app, which is why it works on a stock phone with nothing to configure and no server in the middle. The trade is that MTR here is IPv4 only: a hostname that resolves only to an IPv6 address will not run.
Reading the Hop Table
The screen is two parts: a Summary row, and the hop table under it. Summary shows how many hops were discovered, how many Cycles have completed, and whether the test is still running. Cycles is the number to watch, because every figure in the table is an average over that many passes.
The table has six columns.
# is the TTL. Hop 1 is your own router, and the numbers count outward from there toward the destination.
Host is the address that answered at that TTL. PingKit shows the IP rather than a resolved name, so the column stays stable while the test runs and never stalls waiting on a reverse lookup. A hop that has never answered shows ???.
Loss% is the share of probes sent to that hop that came back with nothing: sent minus received, over sent. PingKit colours it, leaving zero in the normal text colour, yellow below 10 per cent, orange below 50, and red at 50 and above. A hop that has never answered at all shows a dash instead of a percentage, so a silent router is never mistaken for a lossy one.
Avg, Best and Wrst are the mean, minimum and maximum round-trip time to that hop across every probe that came back, in milliseconds. The gap between Best and Wrst is the useful one. A hop with 30 ms best and 400 ms worst is not a slow hop, it is an unstable one, and instability is what a video call notices long before an average moves.
Two things are deliberately not in the table. There is no jitter column, because Best against Wrst already tells you that. And there is no running total, because each row is timed independently from your phone: hop 8 is not hop 7 plus something.
PingKit vs Other MTR Apps
MTR is a niche tool and the App Store has few dedicated versions of it. Most of what turns up in a search is either a traceroute app with a repeat button, or a terminal client that runs the test on someone else's server and shows you the output. We think PingKit holds up well here, but it is worth being straight about where it fits.
What matters
PingKit
Typical MTR or traceroute app
Price
Free, all 19 tools included
Often paid, or free with the results paywalled
Where the test runs
On the iPhone itself
Frequently a remote service the app just displays
Ads & accounts
No ads, no account required
Commonly ad-supported or sign-in gated
Continuous statistics
Loss, average, best and worst per hop, accumulated until you stop
Usually one pass repeated, with no running totals
Beyond MTR
Ping, traceroute, LAN scan, DNS, port scan and the rest of the 19 in one app
Usually the one tool
Export
Screenshot of the hop table
Varies; some offer a text export
IPv6
Not supported
Varies
If the question is "which hop is hurting me, and is it consistent", PingKit answers it on the phone in your hand for nothing. If you need scripted runs, IPv6, or a text export to paste into a ticket, desktop mtr on a machine you control is still the right tool, and nothing here pretends otherwise.
Troubleshooting MTR Results
Loss shows at one hop and then disappears. This is the most common misreading of an MTR table, and it is not a fault. Routers give ICMP the lowest priority, and many answer only some of the echoes aimed directly at them while forwarding everything else perfectly. If hop 4 shows 20 per cent loss and hops 5 through 12 show none, hop 4 is deprioritising your probes, not dropping your traffic. Loss only means something when it starts at a hop and persists through every hop below it.
A hop shows ??? for the whole test. That router is configured not to answer ICMP at all. It is still forwarding your packets, which the hops after it prove: if they answer, the path through the silent one is fine. PingKit shows a dash in Loss% for these rather than 100 per cent, precisely so they do not read as failures.
The last hop never answers, but the site loads fine. Plenty of servers and CDNs drop ICMP by policy. Read the last hop that does answer instead. It is usually the edge of the destination network, and close enough for a diagnosis.
The loss percentages jump around early on. Loss can only move in steps of 100 divided by the number of passes, so after 5 cycles a single missing reply already reads as 20 per cent. Watch the Cycles count in the Summary row and give it at least 30 passes before you believe a figure.
Latency rises at one hop and falls at the next. Each row is timed independently from your phone, so this is normal and not a measurement error. It usually means one router was slow to generate its own reply while forwarding traffic at full speed. Only a rise that persists all the way to the destination is real added delay.
The test stops when you switch apps. iOS suspends the probes when PingKit is not in the foreground. For an intermittent fault, leave the screen open, or use Connection Monitor, which is built for the long watch.
Nothing answers past your own router. Some hotel and corporate networks block outbound ICMP entirely. The table fills with ??? from hop 2 onward, and no amount of waiting will change it. That is a property of the network you are on, not of the path to the destination.
A Second Opinion on the Hop Table
Everything above is the reading a network engineer does by eye: loss at one hop that clears at the next is a router answering probes at low priority, loss that persists to the destination is real, and the spread between Best and Worst says more than the average does. PingKit now does that reading for you. Stop the run and a button appears under the hop table: Explain This Result. Tap it and the run comes back as a few sentences naming the hop the numbers implicate and the figures that are noise. It waits for the stop because a live MTR revises every number on each cycle.
The affordance on a completed run. On MTR it waits for the stop, because a live run revises every number on each cycle.
Nothing about the run is sent and no answer is written until you tap, subscription or not. The answer comes from Apple Intelligence on your iPhone where the hardware and the language allow it, then from Apple Private Cloud Compute, which needs a PingKit Guardian subscription, and from PingKit's own service last. Every answer says which of the three wrote it. It is free: without a subscription you get 15 AI interactions a week, at most 5 a day, shared across every AI feature, and an answer written on the device spends none of them. Only the on-device step keeps the run on the phone. Private Cloud Compute sends it to Apple, and PingKit's own service asks your permission the first time before it receives anything; what travels either way is the run you are looking at, the destination you typed, the cycle count and the hop rows. The button is on 18 tools on iPhone and iPad. The Mac Agent does not have it.
Beyond Standard MTR
Command-line mtr gives you the table and stops there. PingKit puts the same measurement next to the other eighteen tools you reach for in the same sitting, which is where most of the value is. Find the hop with MTR, then open Traceroute for the same path drawn on a map, with each hop's location and the network that owns it. Then hand the link to Connection Monitor to watch it over hours instead of minutes, and to Smart Diagnostics to have the result read back in plain language.
Cert Monitor for 50 domains (5 on Guardian, 1 free), a signed ISO 27001 PDF export, and scheduled, branded reports. $9.99/mo on iPhone and iPad, $4.99/mo on Mac.
Yes, and it runs on the phone itself rather than proxying to a server. PingKit maps the route once by sending ICMP echo requests with a TTL of 1, then 2, and so on up to 30 hops, then re-probes every hop it found about once a second until you stop it. The table keeps a running loss percentage plus average, best and worst latency for each hop, which is exactly what a one-shot traceroute cannot give you. It uses the unprivileged ICMP socket iOS grants any app, so there is nothing to jailbreak or configure.
What is the difference between MTR and traceroute?
Traceroute walks the path once: PingKit probes each TTL from 1 up to 30, retries a hop once if the first probe times out, then stops and shows you the route. MTR runs its own discovery pass first, one probe per TTL with no retry, and then keeps re-probing every hop it found, folding each result into a running loss percentage and a best, average and worst latency per hop until you tap Stop. A single pass cannot tell a fault from a fluke, and accumulated figures can. Both tools are free in PingKit, along with the other 17.
How do I find which hop is causing packet loss?
Run MTR to the destination and read the Loss% column down the hop list. Loss that appears at one hop and disappears at the next is a router deprioritising the ICMP echoes PingKit probes with, not a fault; loss that starts at a hop and persists through every hop below it is the real thing. Give it a minute before drawing conclusions, because after 20 passes a single missing reply already reads as 5 per cent. A hop that has never answered at all shows a dash rather than a percentage, so it cannot be mistaken for loss.
How long should I run an MTR test?
There is no fixed length: MTR runs until you tap Stop, and the Summary row counts the passes as Cycles. Each pass waits one second and then probes every discovered hop in turn, so a pass always takes longer than a second, and longer still when a hop is silent, because each silent hop costs that pass a two-second timeout. Judge by the cycle count rather than the clock, because loss can only be read in steps of 100 divided by the number of passes, putting each missed reply at about 3 per cent after 30 of them. For an intermittent fault leave it running for several minutes with PingKit open, since iOS suspends the test when you switch away.
Can I use MTR results to prove a problem to my ISP?
Yes, within limits. Sustained loss or a latency step that begins at one router and persists all the way to the destination is concrete evidence, and every row carries the hop number, the address that answered, its loss percentage and its best, average and worst latency. Run the same test to two or three unrelated destinations first: if the same hop is bad every time, the fault is that hop rather than the site you were trying to reach. MTR has no export button, so what you send is a screenshot of the hop table together with the cycle count from the Summary row.
Find the problem hop.
Download PingKit free and run MTR from your iPhone in seconds.