HTTP Analyzer and all 19 tools are free. No ads, no account required.
What PingKit's HTTP Analyzer Does
PingKit sends an HTTP request to any URL and breaks down the entire response for you. Instead of guessing why a page loads slowly or an API returns an error, you see exactly what the server sent back: every header, every redirect, the status it returned and how long the whole thing took.
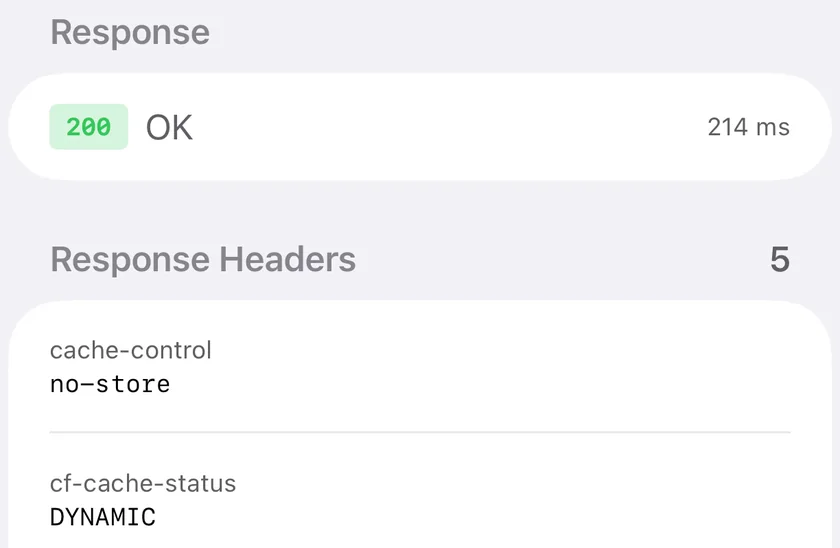
The status, the time it took and the headers the server actually returned, which is usually where the answer is.
Header Inspection
View every response header including cache-control, content-type, security headers like HSTS, and custom server headers. Spot misconfigurations instantly.
Response Timing
See total round-trip time for the request. Pair it with Ping Test for raw connection latency and SSL Inspector for handshake details if you need to isolate a specific phase.
Status Codes
Every HTTP status code is displayed with a clear explanation. Understand the difference between a 301 redirect, a 403 block, and a 504 timeout at a glance.
Request Details
Review the full request and response cycle including redirect chains, final URL, content length, and server identification. Nothing is hidden.
When You Need an HTTP Analyzer
API Debugging
You're on call and an API endpoint is returning errors. Pull out your phone, fire a request with PingKit, and see the exact status code and response headers without opening a laptop. Check whether the issue is a 502 from a load balancer, a 401 from expired auth, or a 500 from the application itself.
Website Troubleshooting
A website isn't loading properly on mobile. Use the HTTP Analyzer to check if the server is responding at all, whether it's sending the right content-type, and if caching headers are configured correctly. You'll know in seconds whether it's a server problem or a client-side issue.
Checking Redirects
Redirect chains are a common source of SEO problems and broken links. The HTTP Analyzer follows every redirect and shows you each hop -- from the initial 301 or 302 through to the final destination. Catch redirect loops and unnecessary hops before they affect your users.
Performance Measurement
Slow page loads often come down to slow server responses, not large files. Total response time tells you whether the server itself is slow to respond; pair it with Ping Test to rule out raw network latency before you tell your ops team where to look.
Building a Request
The request screen is three parts. A URL field, a method picker carrying GET, POST, PUT, DELETE, PATCH, HEAD and OPTIONS, and a headers section where you add as many key and value pairs as you need and swipe any of them away. Choose POST, PUT or PATCH and a body field appears underneath; the other methods do not get one, because they do not take one.
Anything you are going to run more than once can be saved with a name. Saved requests sit at the bottom of the screen, tap one to load it back into the form with its method, headers and body intact, and swipe to delete. It is the part that turns the tool from a one-off checker into something you actually reach for on call, because the awkward request with the four headers and the bearer token is already there.
Requests time out after thirty seconds. That is deliberately long: the interesting case is usually the endpoint that is slow rather than the one that is down, and a short timeout turns the first into the second.
What the Response Shows
The status code, with its message and a colour by class, so 2xx is green, 3xx orange, 4xx red and 5xx purple. The class is usually enough to know whose problem it is before you read the number.
Total time for the whole request. This is the round trip: DNS, connection, TLS, the server thinking, and the response coming back. PingKit does not break that into phases, and it is worth saying so rather than implying otherwise. If you need to know which phase is slow, Ping Test gives you the raw network latency to the same host and SSL Inspector gives you the handshake, and the remainder after subtracting those is the server.
The redirect chain, when there is one. Each hop shows the URL it came from, the URL it went to, and the status that sent it there, so a 301 to a 302 to a 200 is three legible rows rather than a mystery final URL. This is where redirect loops and the pointless http to https to www to https-www chains become obvious.
Every response header, sorted alphabetically with a count next to the section title. Sorting matters more than it sounds when you are hunting for one header on a phone screen and the server sent thirty.
The response body, up to 50 KB. Past that it is truncated, which is a deliberate limit: rendering a multi-megabyte HTML document in a list view on a phone is slow and tells you nothing you could not learn from the first 50 KB.
Reading the Status Code
Most of debugging over HTTP is knowing who to blame, and the status class tells you that immediately[source].
Code
What it means
Where the problem is
200
OK
Nowhere. If it still looks wrong, read the body and the content-type.
301 / 308
Moved permanently
Nowhere, but check the chain. Permanent redirects get cached hard.
302 / 307
Moved temporarily
Usually fine. A 302 where you meant a 301 is a common SEO mistake.
304
Not modified
Nowhere. Your caching headers are working.
400
Bad request
Your request. Usually a malformed body or a missing content-type.
401
Unauthorized
Your credentials. Missing, malformed, or expired auth header.
403
Forbidden
Your credentials are fine and are not allowed to do this. Also what many WAFs return when they do not like you.
404
Not found
The path. Check for a trailing slash and for case.
429
Too many requests
You. Look for a Retry-After header, which PingKit will show you.
500
Internal server error
The application. Something threw and nobody caught it.
502
Bad gateway
Between the proxy and the app. The load balancer is up, what is behind it is not.
503
Service unavailable
Deliberate. Maintenance, or the app refusing load.
504
Gateway timeout
The app is up and too slow. The proxy gave up waiting.
The 502 against 504 distinction is the one worth internalising. A 502 means nothing answered. A 504 means something answered too late. They look identical from a browser and point at completely different failures.
Have PingKit Explain the Result
The table above is the kind of thing you learn once and then stop needing. Until then, the result screen carries a button marked Explain This Result, new in PingKit 3.0. It takes the status code, the response headers and the timing that are already on the screen and puts them in plain language, so the parts of the response you do not recognise get explained next to the parts you do. Eighteen screens across the app carry the same button.
It never fires on its own. There is no summary written while you were reading the headers, and no subscriber version that behaves differently: you tap it, or nothing happens. It sends only the result the screen already showed you.
Three things can write the answer, and every answer is labelled with which one did. Your iPhone's own model goes first. Apple's Private Cloud Compute is second, and that rung is part of a Guardian subscription. PingKit's own service is last, for when neither of the first two is available, and it asks your permission the first time. The button itself is free: without a subscription you get fifteen AI interactions a week, shared across every AI feature in the app and capped at five a day, and an answer your iPhone wrote for itself costs none of them.
iPhone and iPad only. The Mac Agent does not have this button, and it does not have the HTTP Analyzer either: its own tools are ping, traceroute, DNS lookup, port scanning, Wake-on-LAN, speed test, My Network and Security Scan.
PingKit vs Other HTTP Clients
The obvious comparison is Postman, and it is not really a competition: Postman is a full API development environment and PingKit is a diagnostic tool you already have in your pocket. The useful question is which one you want at 2am.
What matters
PingKit
A full API client
Price
Free, all 19 tools included
Free tier, usually with an account and a team plan above it
Account required
No
Commonly yes, with your requests synced to their cloud
Scripting, tests, environments
None
Yes, and this is the real reason to use one
Diagnosing the network under the request
Ping, traceroute, DNS, SSL and port scan on the same host
Usually nothing; the request either works or does not
On a phone, on call
Built for it
Varies, and often a cut-down companion app
If you are building and testing an API, use the API client. If you are trying to work out why an endpoint that worked yesterday does not today, the thing that matters is being able to check DNS, the certificate, the route and the response in one place, and that is the case PingKit is built for.
Troubleshooting HTTP Requests
You get a 403 and the same URL is fine in Safari. The usual cause is the User-Agent. Plenty of sites, and almost every WAF, serve differently to something that does not look like a browser. Add a User-Agent header in the headers section and try again. If that fixes it, you have learned something useful about the server rather than about PingKit.
The request times out but the page loads on the same phone. Check whether the host resolves at all, using DNS Lookup, and whether it answers on the port, using Port Scanner. A site that loads in a browser and times out here is often behind a redirect to a hostname that fails, and the redirect chain will show you where it stopped.
The body is cut off. Expected past 50 KB. If you need the whole document you need a desktop, but for checking a content-type, a meta tag, an error message or the first part of a JSON response, the cap is never the limiting factor.
The certificate is rejected. The request fails before any status code exists, because TLS failed first. SSL Inspector on the same host will tell you whether the chain is incomplete, the certificate expired, or the name does not match, which are three different fixes.
Headers look different from what curl shows you. They probably are. Servers vary responses on the Accept, Accept-Encoding and User-Agent headers, and a request from a phone on a mobile network can legitimately get a different answer than one from a laptop. Set the headers explicitly if you need the two to be comparable.
You expected a redirect and got the final page. That is the redirect chain doing its job. Look at the Redirects section rather than the URL bar: every hop is listed with the status that caused it.
More Than a Simple HTTP Client
PingKit's HTTP Analyzer is built for people who need to understand what's happening at the protocol level. Combined with PingKit's other tools -- ping for latency testing, traceroute for path analysis, DNS lookup for resolution checks -- you can diagnose the full stack of a connectivity issue from a single app. No need to SSH into a server or install developer tools on your phone.
Cert Monitor for 50 domains (5 on Guardian, 1 free), a signed ISO 27001 PDF export, and scheduled, branded reports. $9.99/mo on iPhone and iPad, $4.99/mo on Mac.
Yes. Enter a URL, pick a method (GET, POST, PUT, DELETE, PATCH, HEAD or OPTIONS), add any request headers you need, and PingKit lists every response header the server returned, sorted with a count, next to the status code, the redirect chain, the body and the total round-trip time. Cache-control, content-type, server and security headers such as Strict-Transport-Security are all just headers, so they all appear. HTTPS works against any host; plain http:// works for a local address on your own network, such as http://192.168.1.1 or http://nas.local, but iOS blocks cleartext http:// to a public hostname.
How do I debug a REST API from my iPhone?
Enter the endpoint, pick the method (GET, POST, PUT, DELETE, PATCH, HEAD or OPTIONS), add any headers you need such as an authorisation token, and add a JSON body for the methods that take one. The result gives you the status code, the total round-trip time, every redirect that was followed with the code for each, all response headers, and the body itself, pretty-printed when it is JSON. Bodies over 50 KB are truncated with the full size noted, and a request gives up after 30 seconds.
What does PingKit show for an HTTP status code?
It shows the number, the standard reason phrase for it, and a colour for the class: green for 2xx, orange for 3xx, red for 4xx and purple for 5xx. So a 502 comes back as "502 bad gateway" on a purple badge. Redirects are followed automatically, so the badge carries the code of the final response, and each 301 or 302 on the way is listed in its own Redirects section with the address it pointed at, which is usually the part you actually needed.
Can I check if a website has correct security headers?
You can see which ones it sends. Every response header is listed verbatim, so Strict-Transport-Security, Content-Security-Policy, X-Frame-Options and X-Content-Type-Options appear if the server sets them, and their absence from the list is your answer if it does not. PingKit lists the headers rather than grading them, so the judgement about what should be there stays yours.
Is PingKit's HTTP Analyzer free?
Yes. The HTTP Analyzer and all 19 tools are free, with no ads, no account and no cap on how often you run them. Guardian is a subscription for continuous monitoring rather than for tools: it puts the Mac Agent's data and alert history on your iPhone, raises Uptime Watch from one URL to ten, and gives the AI Apple Private Cloud Compute for questions too large for your iPhone to hold on its own. On iPhone and iPad it is $2.99 a month or $24.99 a year.
Debug any HTTP request.
Download PingKit free and inspect any URL in seconds.